
Introduction
Learning how to create a spreadsheet in Excel is a valuable skill for students, office workers, business owners, teachers, and anyone who wants to organize information efficiently. Microsoft Excel is one of the most widely used spreadsheet applications because it allows users to enter data, perform calculations, manage records, create charts, and analyze information in one place . how to create a spreadsheet in excel
Whether you want to create a monthly budget, track business expenses, organize student grades, manage inventory, or prepare a work report, Excel provides practical tools to complete these tasks. Beginners can start with a blank workbook and gradually learn more advanced features as their needs grow.
The good news is that you do not need advanced technical knowledge to get started. By understanding the basics of rows, columns, cells, formulas, and formatting, you can create a useful spreadsheet in just a few minutes.
This guide explains how to create a spreadsheet in Excel step by step. You will learn how to open a workbook, enter information, format data, use basic formulas, create tables, sort and filter records, save your work, and share your spreadsheet with others.how to create a spreadsheet in excel
What Is a Spreadsheet in Microsoft Excel?
A spreadsheet is a digital document that organizes information into rows and columns. It allows users to store text, numbers, dates, formulas, and other types of data in a structured format.how to create a spreadsheet in excel
Microsoft Excel is a spreadsheet program that makes it possible to organize information and perform calculations automatically. Instead of calculating totals manually, you can enter a formula and let Excel produce the result.
For example, a small business owner might use an Excel spreadsheet to record product names, quantities, prices, and total sales. A student might use it to calculate grades, while a household might use it to track monthly income and expenses.how to create a spreadsheet in excel
Excel files are commonly saved in the XLSX format, although other formats are also available.
Understanding Workbooks and Worksheets
Before creating your first spreadsheet, it is helpful to understand two important Excel terms.
Workbook: A workbook is the Excel file that contains your spreadsheet data. One workbook can contain multiple worksheets.
Worksheet: A worksheet is an individual spreadsheet page inside a workbook. It contains rows, columns, and cells where you enter information.how to create a spreadsheet in excel
For example, you could create one workbook named “Business Records” and include separate worksheets for sales, expenses, inventory, and monthly reports.
This structure helps keep related information organized without creating a separate file for every task.
Why Should You Create a Spreadsheet in Excel?
Excel offers several benefits that make it useful for personal, educational, and professional activities.
1. Organize Information Easily
Excel lets you arrange information into clearly labeled rows and columns. This makes large amounts of data easier to read, update, and manage.
You can use separate columns for names, dates, prices, quantities, addresses, or other information relevant to your task.
2. Perform Automatic Calculations
One of Excel’s most useful features is its ability to calculate results automatically.
For example, you can multiply product quantities by unit prices to calculate sales totals. You can also calculate averages, percentages, and expenses using built-in functions.
When the underlying data changes, formulas generally recalculate automatically when Excel’s calculation mode is set to automatic.how to create a spreadsheet in excel
3. Save Time and Reduce Manual Errors
Manual calculations can take considerable time, particularly when working with hundreds of records. Excel formulas help reduce repetitive work.
Although formulas can contain mistakes, using them correctly makes calculations more consistent and easier to review.how to create a spreadsheet in excel
4. Create Reports and Visualizations
Excel includes tools for creating charts, graphs, and formatted tables. These features help users understand trends, compare figures, and present information more clearly.
For example, a sales chart can show which products perform best, while a monthly expense chart can help identify spending patterns.
5. Share and Collaborate
Excel files can be shared with colleagues, classmates, or business partners. When a workbook is stored in a supported cloud location, such as OneDrive, multiple people can collaborate on it when the file and account settings allow it.how to create a spreadsheet in excel
These features make Excel useful for both individual projects and team-based work.
What You Need Before Creating an Excel Spreadsheet
Before you begin, make sure you have access to Microsoft Excel or a compatible spreadsheet application.
You can use the desktop version of Excel, Excel on the web, or the Excel mobile application. Some features and menus may differ depending on your device, application version, and subscription.
You should also decide what information your spreadsheet will contain.
For example, if you are creating a monthly expense spreadsheet, you might need the following columns:
- Date
- Expense category
- Description
- Payment method
- Amount
If you are preparing an inventory spreadsheet, you might need product names, item codes, quantities, unit prices, and stock levels.
Planning your columns before entering data helps create a cleaner and more useful spreadsheet.how to create a spreadsheet in excel
How to Create a Spreadsheet in Excel Step by Step
Creating a spreadsheet in Excel is straightforward when you follow a clear process. The following steps explain how to build a basic spreadsheet from scratch.
Step 1: Open Microsoft Excel
First, open Microsoft Excel on your computer.
On a Windows computer, you can search for Excel using the Start menu. If it is installed, select the application to open it.
On a Mac, open Excel from your Applications folder or another location where you installed it.
If you do not have the desktop application, you can use Excel on the web through a supported browser and Microsoft account.
After opening Excel, you will usually see options for creating a new workbook or opening an existing file.
how to create a spreadsheet in excel
Step 2: Select a Blank Workbook
Choose the Blank Workbook option to create a new spreadsheet.
A blank workbook opens with a worksheet containing empty cells arranged into rows and columns.
Depending on your Excel version, you may also see templates for budgets, calendars, invoices, schedules, and other common tasks.
A blank workbook is a good choice when you want to build a spreadsheet from scratch. A template can save time when you need a ready-made layout for a familiar task.how to create a spreadsheet in excel
Step 3: Understand Rows, Columns, and Cells
Excel organizes information through rows, columns, and cells.
Rows run horizontally and are identified by numbers such as 1, 2, 3, and 4.
Columns run vertically and are identified by letters such as A, B, C, and D.
Cells are the individual boxes formed where rows and columns intersect.
Each cell has a unique reference. For example, A1 refers to the cell in column A and row 1. Cell C5 refers to column C and row 5.
Understanding cell references is important because Excel formulas use them to identify the values involved in calculations.how to create a spreadsheet in excel
Step 4: Add Column Headings
The next step is to create headings that describe the information you want to record.
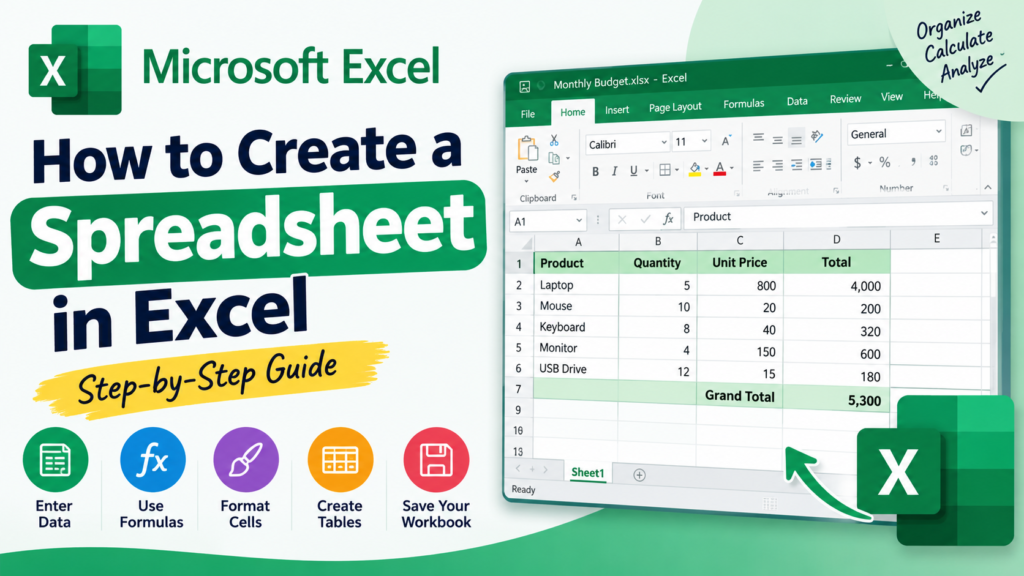
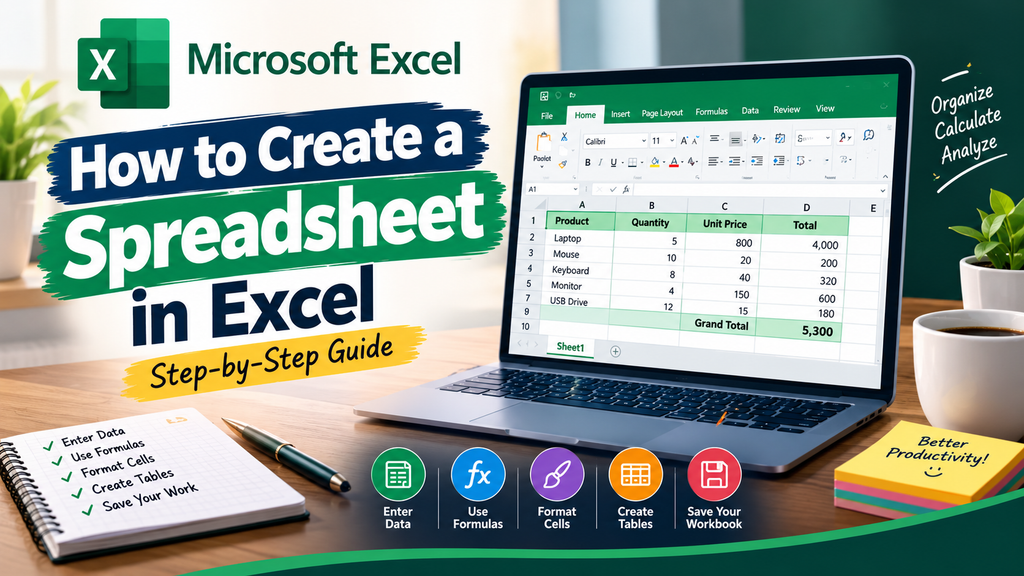
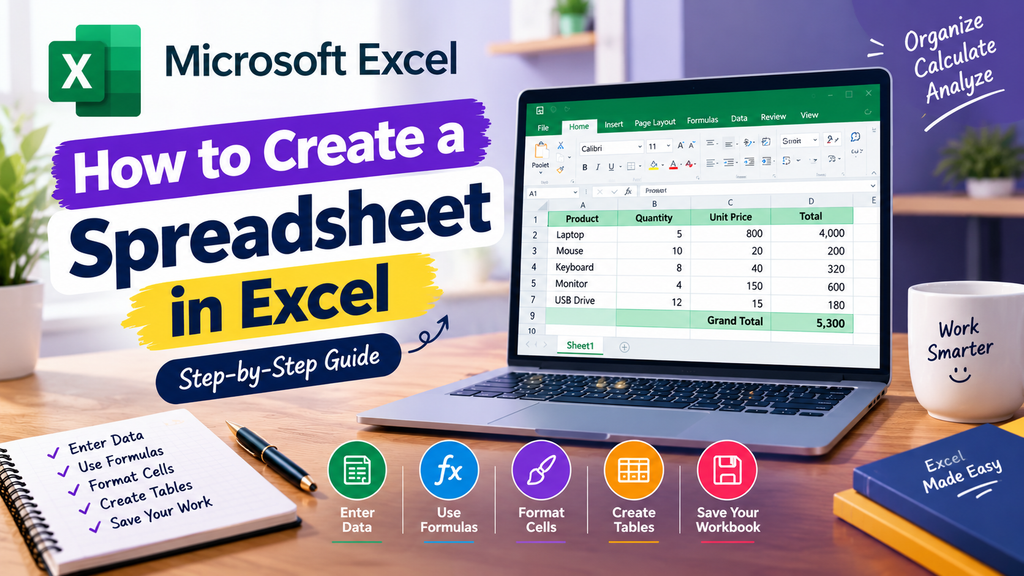
Suppose you want to make a simple sales spreadsheet. You could enter the following headings in row 1:
| Cell | Heading |
| A1 | Product |
| B1 | Quantity |
| C1 | Unit Price |
| D1 | Total |
To enter a heading, click cell A1, type “Product,” and press Enter. Repeat the process for the remaining headings.
Column headings help users understand what each column represents. Use short, descriptive labels rather than unclear abbreviations.how to create a spreadsheet in excel
For larger spreadsheets, clear headings also make sorting, filtering, and creating Excel tables easier.
Step 5: Enter Your Data
After adding the headings, enter your information underneath them.
For example, your spreadsheet might look like this:how to create a spreadsheet in excel
| Product | Quantity | Unit Price | Total |
| Notebook | 5 | 3.00 | 15.00 |
| Pen | 10 | 1.50 | 15.00 |
| Folder | 4 | 2.00 | 8.00 |
The numbers above are illustrative examples.how to create a spreadsheet in excel
Click the first cell below each heading and type the appropriate value. Press Enter or use the arrow keys to move between cells.how to create a spreadsheet in excel
Try to keep one type of information in each column. For example, enter dates in the date column, quantities in the quantity column, and prices in the price column.
Consistent data entry makes the spreadsheet easier to calculate, sort, filter, and analyze.
Step 6: Adjust Column Widths and Row Heights
Sometimes text does not fit inside a cell. Excel may display only part of a long heading or make a value difficult to read.how to create a spreadsheet in excel
You can adjust column widths by moving the pointer to the boundary between two column letters and dragging it left or right.
To automatically fit a column to its contents, double-click the boundary between the column headings.
You can adjust row heights in a similar way by dragging the boundary between row numbers.
Another option is to use the formatting controls available from the Home tab.
Proper spacing improves readability and gives your spreadsheet a more professional appearance.how to create a spreadsheet in excel
Step 7: Format Your Spreadsheet
Formatting helps distinguish headings from data and makes important information easier to identify.
Select the cells you want to format, then use the controls in Excel’s Home tab.
Useful formatting options include:
- Bold text: Makes headings more prominent.
- Font size: Helps distinguish headings from ordinary data.
- Cell borders: Separates rows and columns visually.
- Fill color: Highlights headings or important totals.
- Number formatting: Displays numbers as currency, percentages, dates, or other appropriate formats.
- Text alignment: Positions information consistently inside cells.
For a simple sales spreadsheet, you could make the heading row bold, add a subtle fill color, and format the unit price and total columns as currency.
Avoid using too many colors, fonts, or decorative effects. A consistent design usually makes a spreadsheet easier to understand.how to create a spreadsheet in excel
Step 8: Add Formulas to Calculate Results
Formulas allow Excel to perform calculations using values stored in cells.
In the example above, you can calculate the total for the first product by entering this formula in cell D2:
=B2*C2
This formula multiplies the quantity in B2 by the unit price in C2.
For the notebook example, the calculation is 5 multiplied by 3.00, which produces 15.00.
Press Enter to display the result.
You can repeat the process for other rows by adjusting the cell references. Alternatively, use Excel’s fill handle to copy the formula down the column.
Formulas usually begin with an equals sign (=). Excel supports many mathematical operations and built-in functions, making it possible to perform calculations without manually working out every result.how to create a spreadsheet in excel
Step 9: Review Your Spreadsheet
Before saving your work, check that the information is accurate and organized.
Review the headings, numbers, dates, formulas, and formatting. Confirm that the formulas refer to the correct cells and that currency or percentage values use the appropriate formats.
Look for blank rows inside your data, duplicate records, inconsistent spelling, or numbers accidentally entered as text.
If you notice a mistake, select the relevant cell and correct its contents.
A short review can prevent errors from affecting later calculations or reports.how to create a spreadsheet in excel
Step 10: Save Your Excel Spreadsheet
Once your spreadsheet is ready, save it to a suitable location.
Select File, then choose Save As if you need to specify a file name and location. In some versions, the Save command or another prompt may appear first.
Choose a folder, enter a descriptive file name, and select the desired file format.
For a standard Excel workbook, the usual format is Excel Workbook (.xlsx).
For example, you might name your file Monthly_Sales_Report.xlsx.
Click Save to store the file.
If you are using Excel on the web, your workbook may be saved automatically to a supported cloud location, depending on how it was created and where it is stored.how to create a spreadsheet in excel
After saving, reopen the file or verify its location if the spreadsheet is important.
How to Enter and Organize Data in Excel
Entering data correctly is essential for creating a reliable spreadsheet. Excel can store text, numbers, dates, times, and formulas, but the way you enter information affects how the program handles it.how to create a spreadsheet in excel
Keep One Type of Information in Each Column
A well-organized spreadsheet typically uses one column for each type of information.
For example, a customer list could contain columns for customer name, email address, phone number, and registration date.
Avoid combining unrelated details in one cell unless there is a specific reason to do so.how to create a spreadsheet in excel
Use Consistent Formats
If you enter dates in different formats, it may become difficult to sort or analyze them correctly. Use a consistent date format throughout the worksheet.
Likewise, use the same currency and number formats for comparable values.
Consistency helps Excel recognize and process information correctly.how to create a spreadsheet in excel
Use Descriptive Headings
Headings such as “Date,” “Customer Name,” “Quantity,” and “Amount” are more useful than vague labels such as “Info” or “Value.”
Descriptive headings also make the spreadsheet easier for another person to understand.how to create a spreadsheet in excel
Avoid Unnecessary Blank Rows
When creating a continuous data table, avoid inserting blank rows between individual records. Blank rows can interfere with sorting, filtering, and other data operations.
If you need to separate sections visually, consider using formatting or separate worksheets instead.
How to Use Basic Excel Formulas and Functions
Excel formulas help automate calculations. You can use simple arithmetic operators or built-in functions depending on the task.
1. SUM Function
The SUM function adds numbers together.
For example:
=SUM(D2:D10)
This formula adds the values in cells D2 through D10.
It is useful for calculating total sales, expenses, inventory quantities, or other numerical values.
2. AVERAGE Function
The AVERAGE function calculates the arithmetic mean of a group of numbers.
For example:
=AVERAGE(B2:B10)
This formula calculates the average of the numerical values in cells B2 through B10.
It can be useful for average test scores, average monthly expenses, or average sales.
3. COUNT Function
The COUNT function counts cells containing numbers.
For example:
=COUNT(B2:B20)
This formula counts the cells in the specified range that contain numerical values.
It does not count every nonempty cell. If you want to count nonempty cells containing text or other content, consider the COUNTA function.
4. IF Function
The IF function returns one result when a condition is true and another result when it is false.
For example:
=IF(B2>=50,”Pass”,”Fail”)
This formula displays “Pass” if the value in B2 is at least 50. Otherwise, it displays “Fail.”
It can be useful for grading systems, stock alerts, and simple decision-making tasks.
5. Multiplication and Other Calculations
Excel supports basic mathematical operators:
- Addition: =A1+B1
- Subtraction: =A1-B1
- Multiplication: =A1*B1
- Division: =A1/B1
These formulas can be used to calculate prices, differences, ratios, and other numerical results.
Remember that formulas depend on the cells they reference. If you move data or change a formula incorrectly, the result may no longer be accurate.
How to Create a Table in Excel
An Excel table provides a structured way to manage related information.
To create a table, first select the cells containing your headings and data. Then select Insert, followed by Table. Depending on your Excel version, you may also be able to use the keyboard shortcut Ctrl+T on Windows.
Confirm the selected range and make sure the option indicating that your table has headers is selected if your first row contains column headings.
Click OK to create the table.
Excel tables can provide several benefits:
- Apply consistent formatting.
- Add filter controls to column headings.
- Expand when new data is entered directly next to or within the table.
- Use structured references in formulas.
- Make records easier to manage.
For example, a sales table with columns for Product, Quantity, Unit Price, and Total can be sorted by product name or filtered to display selected records.
Tables are particularly useful when your spreadsheet will grow over time.how to create a spreadsheet in excel
How to Sort and Filter Spreadsheet Data
Sorting and filtering are helpful when a worksheet contains many records.
Sorting Data
Sorting rearranges information according to a selected column.
For example, you can sort customer names alphabetically or arrange sales amounts from largest to smallest.
To sort data, click a cell in the relevant column and use the sorting options available under the Data tab. When working with related records, ensure that the entire dataset is sorted together so that values remain associated with the correct record.how to create a spreadsheet in excel
Filtering Data
Filtering temporarily displays only records that match selected conditions.
For example, a business owner could filter a sales spreadsheet to show a particular product, month, or category.
If you created an Excel table, filter controls are usually available in its column headings. Select a filter and choose the values or conditions you want to display.
Filtering does not normally delete the other records; it hides rows that do not meet the selected conditions.
These tools make large spreadsheets easier to explore without creating a separate worksheet for every category.how to create a spreadsheet in excel
How to Create Charts and Graphs in Excel
Charts convert numerical data into a visual format that can be easier to understand.
Excel supports several chart types, including column charts, bar charts, line charts, and pie charts.how to create a spreadsheet in excel
Step 1: Select Your Data
Select the data you want to visualize, including the relevant headings.
For example, you could select monthly sales figures with one column for month names and another for sales amounts.Excel supports several chart types, including column charts, bar charts, line charts, and pie charts.how to create a spreadsheet in excel
Step 2: Insert a Chart
Open the Insert tab and select an appropriate chart type.
Excel will create a chart based on your selected data. The available chart recommendations and options may vary according to the Excel version.
Step 3: Customize the ChartExcel supports several chart types, including column charts, bar charts, line charts, and pie charts.how to create a spreadsheet in excel
Add a descriptive title, check the axis labels, and adjust the chart layout if necessary.
Choose a chart type that matches the information you want to present. A line chart is often useful for showing changes over time, while a column chart can help compare categories.
Avoid using a chart simply for decoration. It should help readers understand the information more quickly.
How to Create a Budget Spreadsheet in Excel
A monthly budget is a practical first project for anyone learning how to create a spreadsheet in Excel.
It helps you compare income with expenses and understand where your money goes.Excel supports several chart types, including column charts, bar charts, line charts, and pie charts.how to create a spreadsheet in excel
Step 1: Add Budget Headings
Create the following columns:
- Date
- Category
- Description
- Income
- Expense
- Balance
Step 2: Enter Your Records
Enter your income and expenses in the appropriate columns. Categories might include rent, groceries, transport, utilities, education, and entertainment.
Use consistent dates and numerical formats.Excel supports several chart types, including column charts, bar charts, line charts, and pie charts.how to create a spreadsheet in excel
Step 3: Calculate Total Income
If your income entries are in cells D2 through D30, use:
=SUM(D2:D30)
This adds the income values in the selected range.
Step 4: Calculate Total Expenses
If expenses are in cells E2 through E30, use:
=SUM(E2:E30)
This adds the expense values in the selected range.Excel supports several chart types, including column charts, bar charts, line charts, and pie charts.how to create a spreadsheet in excel
Step 5: Calculate the Difference
You can calculate the difference between total income and total expenses by subtracting the expense total from the income total.
For example, if total income is in D32 and total expenses are in E32, enter:
=D32-E32
The result indicates the amount remaining after the recorded expenses are deducted from recorded income.
This is a simplified budget example. For a running balance, you would need to design a separate formula that updates the balance row by row.Excel supports several chart types, including column charts, bar charts, line charts, and pie charts.how to create a spreadsheet in excel
How to Create an Inventory Spreadsheet in Excel
An inventory spreadsheet helps businesses monitor products, quantities, prices, and stock levels.
Start by creating these column headings:
- Product ID
- Product Name
- Category
- Quantity in Stock
- Unit Price
- Total Value
Enter each product on a separate row.
To calculate the total value of the stock for a product, multiply the quantity by the unit price. If quantity is in D2 and unit price is in E2, use:Excel supports several chart types, including column charts, bar charts, line charts, and pie charts.how to create a spreadsheet in excel
=D2*E2
Copy the formula down the Total Value column for the remaining products.
You can then convert the range into an Excel table and use filters to find specific products or categories.
For more advanced inventory tracking, you might add reorder levels, supplier names, purchase dates, and stock movement records.
However, an Excel spreadsheet is only as reliable as the information entered into it. Update stock quantities regularly and check calculations to avoid discrepancies between recorded and actual inventory.Excel supports several chart types, including column charts, bar charts, line charts, and pie charts.how to create a spreadsheet in excel
How to Create a Spreadsheet in Excel Online
Excel Online allows users to create and edit spreadsheets in a supported web browser.
It is useful for people who want to work without installing the desktop application on their computer.Excel supports several chart types, including column charts, bar charts, line charts, and pie charts.how to create a spreadsheet in excel
Step 1: Open Excel on the Web
Open Microsoft’s Excel web application through a supported browser and sign in with your Microsoft account when required.Excel supports several chart types, including column charts, bar charts, line charts, and pie charts.how to create a spreadsheet in excel
Step 2: Create a New Workbook
Choose the option to create a blank workbook or select an available template.
A new worksheet will open, allowing you to enter data into cells.Excel supports several chart types, including column charts, bar charts, line charts, and pie charts.how to create a spreadsheet in excel
Step 3: Enter and Format Data
Add your headings, enter records, adjust column widths, and apply basic formatting.
Many familiar spreadsheet operations are available online, although some advanced features may differ from the desktop version.Excel supports several chart types, including column charts, bar charts, line charts, and pie charts.how to create a spreadsheet in excel
Step 4: Save and Access Your Work
Depending on your workflow, your workbook may be saved to OneDrive or another supported location.
Cloud storage can make it easier to access the file from different devices and collaborate with other users.
Before sharing, review the permissions and confirm whether recipients can view or edit the workbook.z
How to Save, Rename, and Share an Excel Spreadsheet
Saving your spreadsheet with a meaningful name makes it easier to find later.
Choose a name that explains the file’s purpose. Examples include Monthly_Budget.xlsx, Student_Grades.xlsx, or Inventory_Records.xlsx.
If you need to rename or save the workbook in another location, use the relevant options in the File menu or the controls available in your version of Excel.
Choosing the Right File Format
The XLSX format is the standard choice for most modern Excel workbooks.
Other formats may be useful for particular purposes. For example, CSV files store tabular data as plain text separated by delimiters, but they do not preserve all Excel formatting, formulas, worksheets, or workbook features.
If you need to retain your workbook’s structure and formatting, use an appropriate Excel workbook format.
Sharing Your Spreadsheet
You can share a workbook through a supported cloud service or send a copy of the file.
When sharing a cloud-based workbook, choose permissions carefully. Some links allow recipients only to view the file, while others allow editing.
If your spreadsheet contains confidential customer, employee, or financial information, share it only with authorized people.
For important records, maintain a backup and avoid overwriting the only copy of a file you may need later.
How to Print an Excel Spreadsheet
Sometimes you need a paper copy of your spreadsheet for a meeting, classroom, or business report.
Before printing, check how the worksheet will appear on the page.
Select the relevant print options, preview the output, and adjust the orientation, margins, scaling, or paper size if necessary.
If your spreadsheet contains many columns, landscape orientation may help fit the information across the page.
You can also select a specific print area when you want to print only part of a worksheet.
Check that headings are visible, text is readable, and important columns are not cut off. A spreadsheet that looks clear on a computer screen may need adjustments to print properly.
Common Excel Spreadsheet Mistakes to Avoid
Beginners sometimes make simple mistakes that can cause problems later. Knowing what to avoid can help you build a more reliable spreadsheet.
1. Using Unclear Column Headings
Headings such as “Data 1” or “Other” do not explain what a column contains. Use descriptive labels that clearly communicate the information.
2. Mixing Different Types of Data
Avoid placing dates, quantities, and unrelated text in the same column. Consistent columns make it easier to sort and calculate values.
3. Entering Formulas Incorrectly
A formula may return an incorrect result if it references the wrong cells or uses the wrong operator. Check formulas carefully, particularly when copying them across multiple rows.
4. Forgetting to Save Important Changes
Save your work regularly when using a workflow that requires manual saving. If automatic saving is available, verify that the file is stored in the expected location.
5. Overusing Colors and Formatting
Too many colors, fonts, borders, and merged cells can make a spreadsheet difficult to read. Use a consistent style and highlight only the information that needs attention.
6. Leaving Duplicate or Incorrect Records
Duplicate entries can distort totals and reports. Review your data regularly and use Excel’s data tools to identify problems.
7. Sharing Files Without Checking Permissions
A shared spreadsheet may contain information that should not be publicly available. Review sharing permissions before sending a link or uploading a file.
8. Ignoring Accessibility and Readability
Use clear headings, sufficient contrast, readable text, and logical layouts. These practices make your spreadsheet easier for more people to use.
Tips for Creating a Professional Excel Spreadsheet
A professional spreadsheet should be accurate, organized, easy to navigate, and simple to maintain.
Follow these recommendations to improve the quality of your work.
Use a consistent layout. Keep headings, number formats, and spacing consistent throughout the workbook.
Freeze important headings. When working with a long worksheet, use the Freeze Panes option to keep selected rows or columns visible while scrolling.
Convert structured data into a table. Excel tables make it easier to filter, sort, and manage records.
Use formulas instead of repeated manual calculations. Formulas can improve consistency and reduce repetitive work, provided they are checked carefully.
Add totals where they are useful. A summary row or clearly labeled total can help readers understand the main figures.
Use conditional formatting carefully. Conditional formatting can highlight values that meet particular conditions, such as low inventory or expenses above a chosen threshold.
Separate raw data from reports when appropriate. Keeping source records separate from summaries can make complex workbooks easier to maintain.
Use meaningful worksheet names. Names such as “Sales,” “Expenses,” and “Inventory” are easier to understand than generic labels such as “Sheet1” and “Sheet2.”
Review formulas and data regularly. Check for errors whenever records change or new information is added.
Keep backups of important files. A backup can protect against accidental deletion, file corruption, or unwanted changes.
Frequently Asked Questions About Creating a Spreadsheet in Excel
1. How do I create a spreadsheet in Excel for beginners?
Open Microsoft Excel and select Blank Workbook. Enter column headings in the first row, add your information underneath, and format the cells to improve readability. Use formulas if you need calculations, then save the file in Excel workbook format.
2. Can I create an Excel spreadsheet for free?
You may be able to use Excel on the web with a Microsoft account, depending on Microsoft’s current service requirements. The desktop application may require a qualifying license or subscription. Other spreadsheet applications are also available, although their features and compatibility may differ.
3. How do I create a spreadsheet from scratch?
Start with a blank workbook, identify the information you want to record, and create appropriate column headings. Enter your data, apply consistent formatting, add formulas if necessary, review the results, and save the workbook with a descriptive name.
4. What is the difference between a workbook and a worksheet?
A workbook is the Excel file, while a worksheet is an individual spreadsheet page inside that file. A single workbook can contain multiple worksheets for related categories of information.
5. How do I save an Excel spreadsheet?
Select File and choose Save or Save As, depending on your situation and Excel version. Choose a location, enter a file name, select Excel Workbook (.xlsx) when appropriate, and confirm the save operation.
6. How do I add formulas to an Excel spreadsheet?
Click the cell where you want the result, type an equals sign followed by a formula, and press Enter. For example, =A1+B1 adds the values in cells A1 and B1, while =SUM(A1:A10) adds the values in a range.
7. Can I create an Excel spreadsheet on my phone?
Yes. You can use the Excel mobile application on supported Android and iOS devices. You can create workbooks, enter data, and perform many common spreadsheet tasks, although some features may be more limited than those in the desktop application.
8. How do I create a spreadsheet with formulas?
First, organize your information into columns and rows. Then select the cell where you want a calculated result and enter a formula using cell references. For example, =B2*C2 multiplies the values in B2 and C2. Copy the formula to other rows when necessary.
9. How do I make my Excel spreadsheet look professional?
Use descriptive headings, consistent number formats, readable fonts, appropriate column widths, and restrained colors. Convert structured data into a table and use formulas, filters, and charts where they provide a clear benefit.
10. Can I create a spreadsheet without installing Excel?
Yes. Excel on the web can be used through a supported browser, subject to Microsoft’s account and service requirements. Other online spreadsheet applications can also create and edit tabular data.
11. What is the best file format for an Excel spreadsheet?
For most standard Excel workbooks, XLSX is the recommended format. It preserves workbook structure, formatting, formulas, and multiple worksheets. CSV is useful for exchanging simple tabular data but does not preserve all workbook features.
12. How can I organize large amounts of data in Excel?
Use descriptive column headings, consistent data formats, and one record per row. Convert the data into an Excel table, then use sorting and filtering to find specific records. For more advanced analysis, consider PivotTables and other data analysis features.
Conclusion
Learning how to create a spreadsheet in Excel is a practical first step toward improving your data organization and productivity. Excel makes it possible to store information, perform calculations, create reports, and visualize results in one application.
To create your first spreadsheet, open a blank workbook, add clear column headings, enter your data, adjust the formatting, and use formulas where calculations are required. You can then organize your information with tables, sorting, and filters before saving your work.
As you become more familiar with Excel, you can explore charts, conditional formatting, advanced functions, and other features that make complex tasks easier to manage.
The most important principle is to keep your spreadsheet accurate, organized, and easy to understand. Start with a simple project, practice the basic steps, and gradually build your skills. With regular practice, you can use Excel to manage budgets, track expenses, organize business records, analyze information, and complete everyday tasks more efficiently.